This April, the Social Security Advisory Board will recognize National Social Security Month with the launch of a new set of charts and data related to retirement. For more than a decade, SSAB has published and updated a Disability Chartbook, highlighting data related to the administration of Social Security’s disability programs: Disability Insurance and Supplemental Security Income. This month, we will start building up a comparable collection of charts on Social Security’s retirement program. We invite you to return to our website weekly for new chart collections.
For the first week of April, we will highlight data on when people are claiming Social Security, why, and what that means for their benefits. View the weekly installments below.
Week 1: When Do People Claim Social Security?
06/26/2017
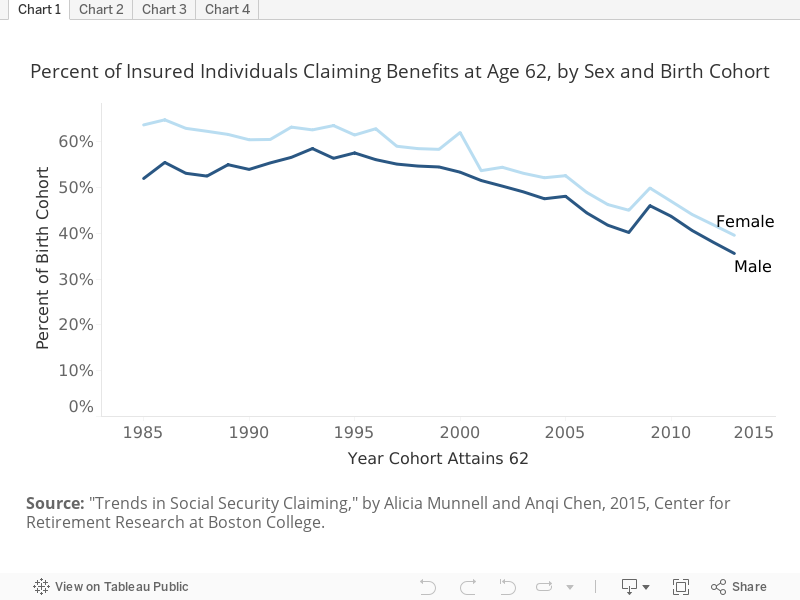
During the past several decades, workers eligible for Social Security have been claiming their benefits at later ages. The earliest age a person can claim their own retirement benefit is 62, and for many years that is when the majority of people claimed their benefit. Since the mid 1980s that share has fallen substantially, for both males and females. Researchers from Boston College’s Center for Retirement Research find that insured individuals turning age 62 in 2013 are about 20 percentage points less likely to claim Social Security benefits at that age, compared to insured individuals reaching 62 in 1985. The first chart, below, highlights this trend.
Note that claiming Social Security benefits does not mean an individual must stop working.
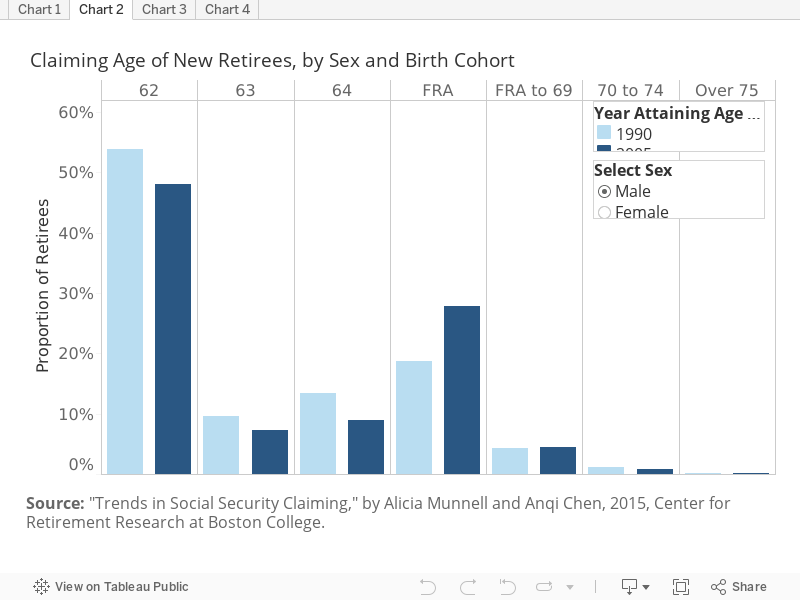
More and more workers insured by Social Security are claiming at or after the full retirement age (FRA). The chart below compares two birth year cohorts: one attaining age 62 in 1990 when the full retirement age was 65, and the other in 2005, when the full retirement age had increased to 66. In that 15 year span, claiming at or beyond the FRA increased by about 9 percentage points for males and 8 percentage points for females. Starting this year, the FRA will further increase by 2 months annually until it reaches 67 for individuals attaining age 62 in 2022.
In the chart below, use the selector to toggle between male and female retirees.
Claiming Social Security before the full retirement age permanently reduces a person’s monthly benefits, but increases the total number of years of benefit receipt, since benefits are paid until death. Additionally, claiming after the full retirement age permanently increases benefits, but will decrease the total years of benefit receipt.
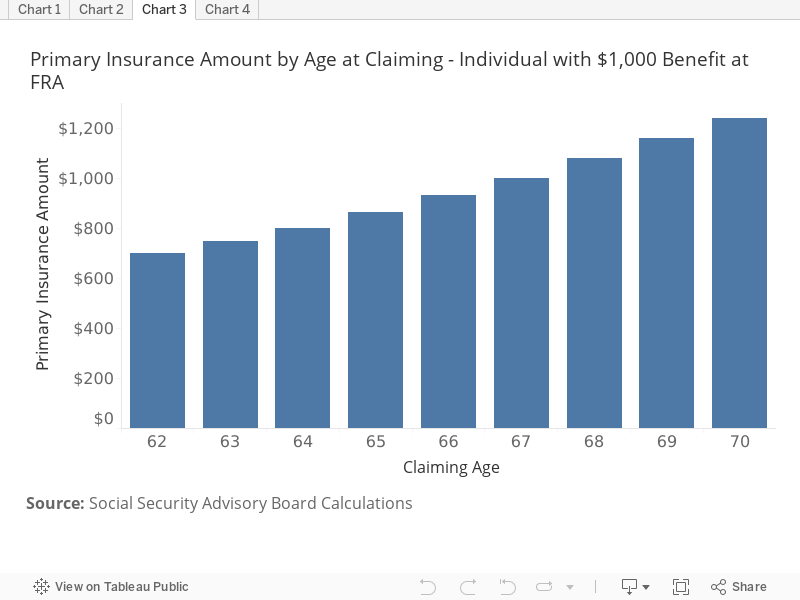
Retired worker benefits are first calculated as if an individual is retiring at the full retirement age, and then increased or decreased based on the actual date they are claimed. For example, at a full retirement age of 66, a person claiming at the earliest age of eligibility — age 62 — would receive a monthly benefit 25 percent less than would be available at age 66. Those who claim at age 70 — the last age associated with a benefit increase — would receive a benefit 32 percent larger than would be available to them at age 66. When the full retirement age reaches 67, individuals who claim their benefits at age 62 would receive an amount 30 percent less than available at age 67, while those who delay until age 70 would receive a benefit 24 percent larger than available to them at 67. In practice, for a given retirement age, an increase in the full retirement age is equivalent to a benefit reduction.
The chart below shows how benefits increase or decrease for various retirement ages, assuming a full benefit of $1,000 and a full retirement age of 67.
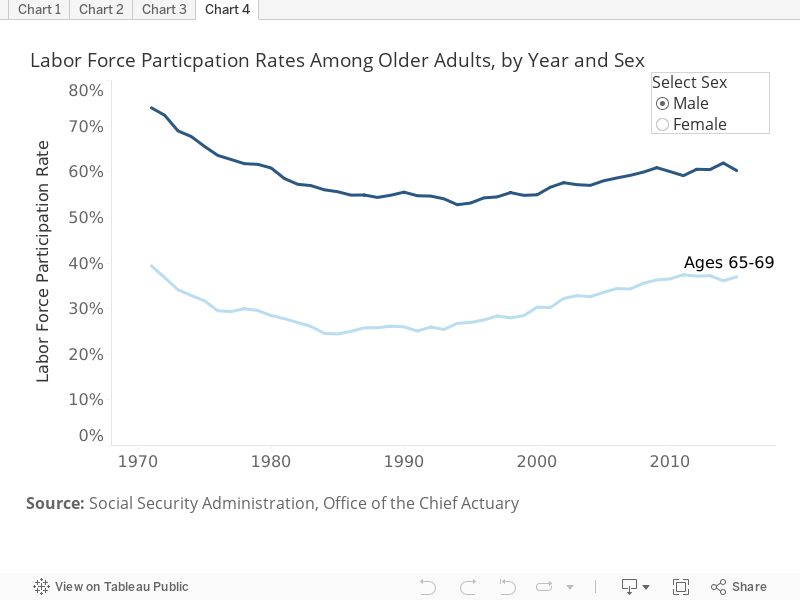
As mentioned above, individuals are waiting longer to claim Social Security when compared to previous decades. They have also been increasing their participation in the labor force at older ages. Labor force participation rates among individuals in their 60s have been steadily on the rise since the early 1990s. Researchers have posited several reasons for these trends, including longer lifespans, better health in older age, incentives from participation in investment based retirement plans, more legal protection from age discrimination, and fewer physically demanding jobs. People who choose to work longer can also get a higher monthly benefit if they wait to collect their Social Security benefits. Other Social Security policy changes, such as the increase in the full retirement age and the elimination of the retirement earnings test above the full retirement age also improve the payoff to working longer and delaying claiming Social Security retirement benefits.
The chart below shows labor force participation rates over time for two age groups: 60 to 64 and 65 to 69. The chart is stratified by sex, and you can use the selector buttons to toggle between male and females.
Week 2: How Does Demography Affect Social Security?
4/14/2017
Social Security benefits are financed mostly by payroll taxes levied on current workers. Shortfalls are financed through a Trust Fund, the balance of which shrinks when total costs (benefits plus administrative expenses) exceed total revenues (payroll and income taxes plus interest earnings on accumulated reserves). The differential between costs and revenues is linked directly to the ratio of workers paying payroll taxes to beneficiaries, and thus linked to U.S. demography.
At the end of 2015, the Old Age and Survivors Insurance (OASI) Trust Fund held $2.78 trillion, about 3.7 times annual OASI benefits. Since 2011, OASI Trust Fund reserves have risen in value but declined as a multiple of program costs. Reserves are projected to be depleted in 2035.
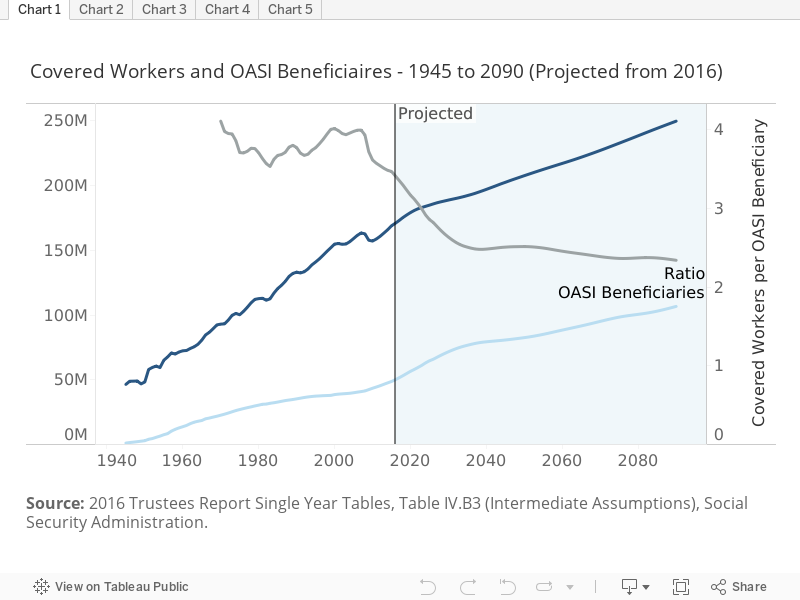
The first chart, below, shows historical and projected ratios of “covered workers” — those who pay Social Security payroll taxes — to beneficiaries of the OASI program. The number of beneficiaries is projected to grow faster than the number of workers; as a result, this ratio is projected to decline. As of 2015, there are 3.5 covered workers for every OASI beneficiary. That ratio is projected to drop to 2.5 by 2035.
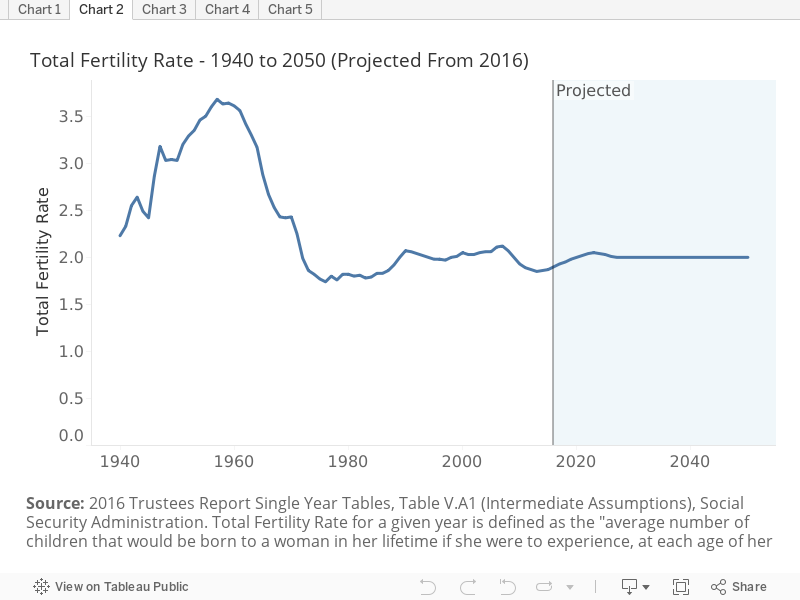
The current and projected increase in the number of OASI beneficiaries is traceable largely to the anticipated retirement of the baby boom generation. The chart below shows the total fertility rate —the number of children each woman is projected to bear over her lifetime, given the birth rates observed in each year. The fertility rate rose sharply in the two decades after World War II and then fell. The children born during the high-birth-rate years, known as the baby boom, are just now reaching retirement age.
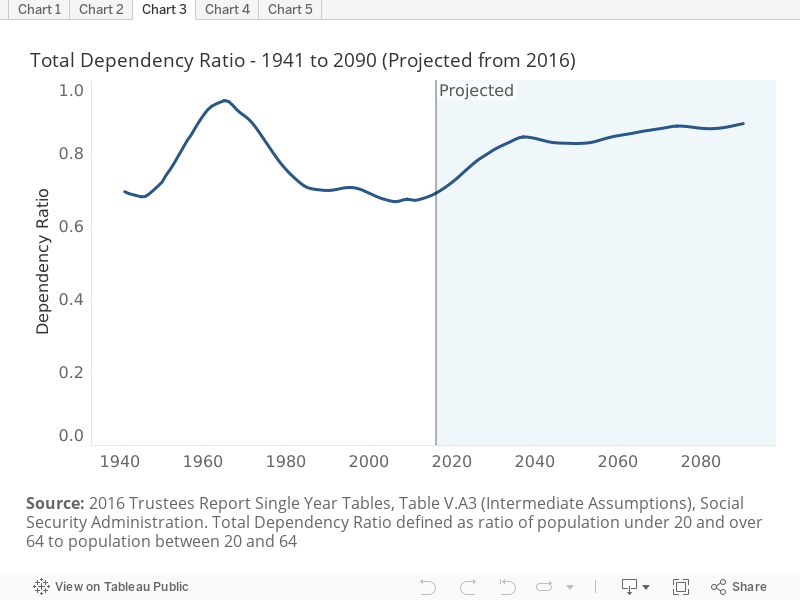
The working age population—those aged 20 to 65—must support both the elderly and the young, as well as people with disabilities and those who choose not to or are unable to work. The next chart shows the dependency ratio, defined as the ratio of those over age 65 and under 20 to the working age population. This ratio rose sharply during the years when birth rates were high, fell as the baby-boomers matured, and will rise once again as they retire.
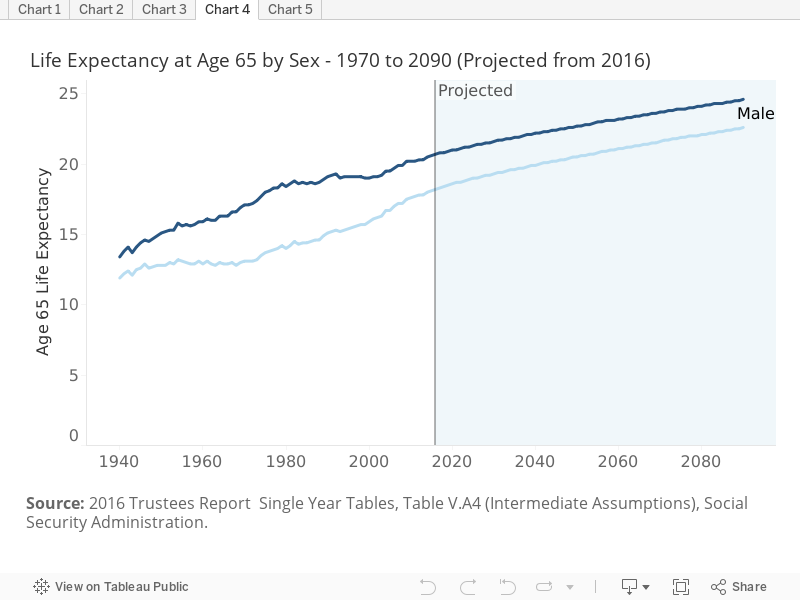
Rising life expectancies lengthen the period over which retirees may receive benefits, thereby adding to the numbers of beneficiaries alive at each moment. Life expectancy at age 65 has risen steadily and is projected to continue doing so. Men turning 65 today are expected to live for 18.1 more years; by 2050 65-year-old men are expected to live for 20.5 additional years. For women, life expectancy at age 65 is projected to increase from 20.6 years today to 22.7 years in 2050.
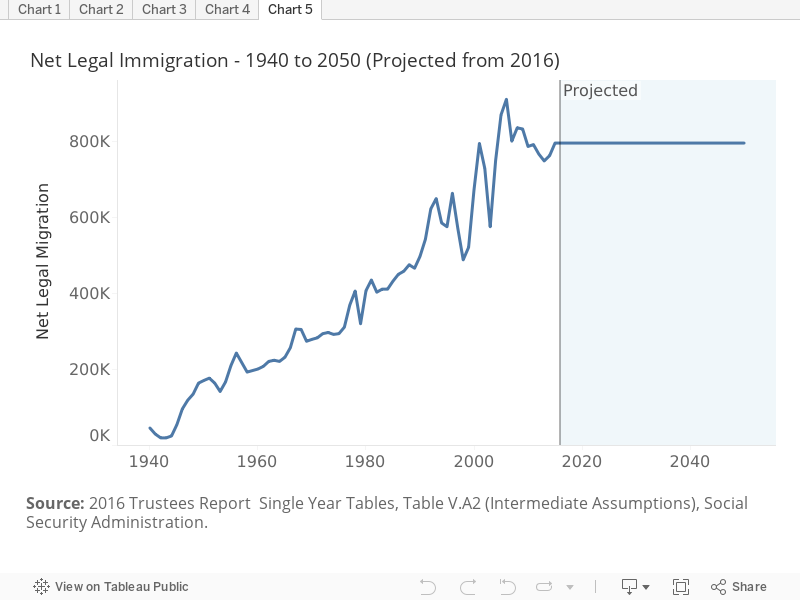
The size of the labor force depends not only on births but also on net immigration. Immigrants typically enter the country as working age adults, paying payroll taxes soon after entry but not claiming benefits until much later. Net immigration varies widely from year to year, as flows depend sensitively on public policy and economic conditions. On balance, however, the flow has increased over time. Current projections assume that net inflows will level off.
Week 3: Will Social Security Be There When I Retire?
04/21/2017
Social Security pays benefits directly from tax revenues, primarily from payroll taxes and to a much lesser extent from the income taxation of benefit payments. When tax revenues exceed the cost of paying benefits, the excess funds are used to purchased special-issue Treasury bonds which are accounted for in the Social Security Trust Fund. When benefit expenditures exceed tax revenues, then Social Security redeems some of the bonds in the trust fund to enable full payment of benefits. If benefit expenditures exceed revenue by a sufficient amount for a sufficient length of time, the trust fund reserves will be exhausted. At that point Social Security will still pay benefits, but only in the amount equal to its current tax revenues.
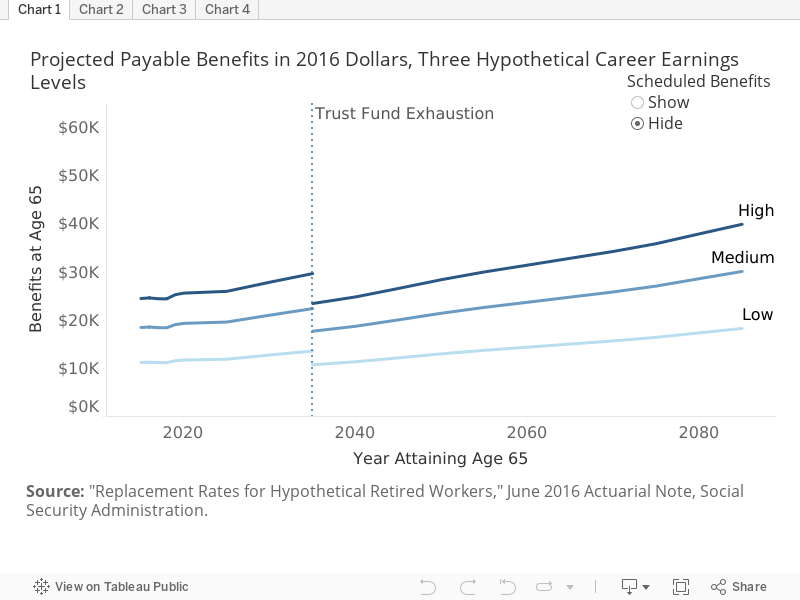
The first chart shows the average benefits that can be paid by Social Security for a set of hypothetical individuals with three different levels of career average earnings, measured in inflation adjusted dollars. Three important facts stand out. First, in all cases benefits will continue to be paid for the foreseeable future. Second, Social Security payments will fall dramatically sometime around 2035, as the trust fund reserves are exhausted, and tax revenues will only be sufficient to pay about 77 percent of what is currently scheduled by law. By 2090, revenues will only be sufficient to pay about 74 percent of the current law scheduled amount. Third, benefits tend to rise faster than inflation over time, that is because benefits are indexed to increases in economy-wide average wages.
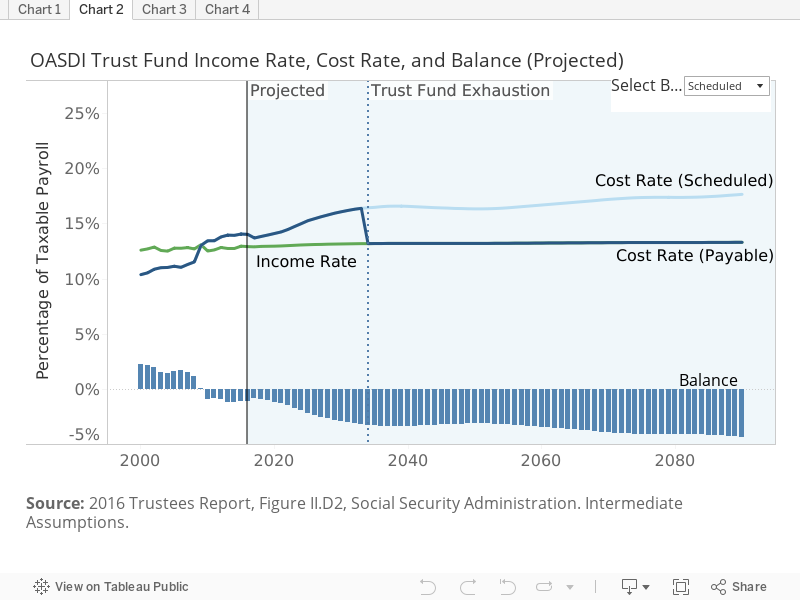
The next chart describes the long-term financial imbalances in the Social Security system. During prolonged periods in the past, income exceeds costs and positive balances were credited to the Social Security trust fund. Since 2010 and for the foreseeable future, the cost to pay scheduled benefits exceeds it tax income. In reality, the system cannot independently borrow funds to make up its annual deficits. Until roughly 2035, the bonds held in the trust fund will be redeemed to make up those deficits, but after the point of trust fund reserve exhaustion, the system’s cost will have to equal its income. Annual balances will effectively be zero. As a whole the system will only be able to pay out about 77 percent of what is scheduled under current law. Under the normal legislative process, Congress has the ability to change the law to bring revenues and expenditures in balance, either by increasing revenues, decreasing benefits or a combination of the two.
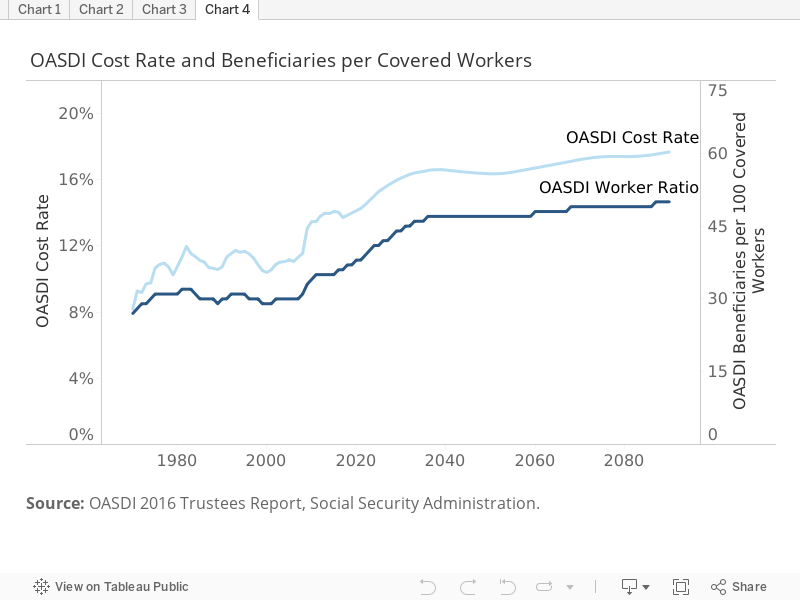
The chart below expresses program costs and revenues as a percent of U.S. taxable payroll. The income rate is the ratio of non-interest revenue to taxable payroll, while the cost rate is ratio of program costs (benefits and administrative costs) to taxable payroll. The balance is the difference between the two. When the trust fund is exhausted, scheduled benefits would no longer be payable, and costs would fall to the same level as revenues (the income rate).
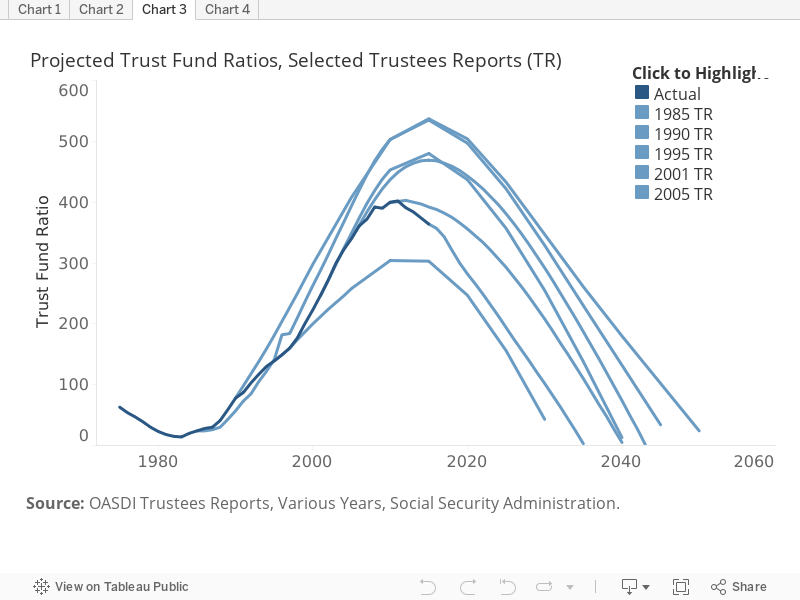
Those responsible for projecting the long-term financial status of the Social Security program have long known that under current tax rates and benefit levels, there would eventually be insufficient funding to pay for the level of benefits scheduled in current law. In 1985 — two years after the last major legislative effort to address long-term shortfalls in the systems finances — it was projected that there would be sufficient funds to last until 2050. A decade later the projection was far more pessimistic, with trust fund reserve exhaustion projected for 2031. Several years later, the expectation was revised to sometime in the mid to early 2040s. The Great Recession sharply reduced expected tax revenues and now the Social Security Trustees project reserve depletion of the Old Age and Survivors Insurance trust fund in 2035.
In the chart below, click in the legend to highlight the trust fund projection from a particular Trustees Report.
Under current law, the payroll tax rate and the tax base to which those payroll taxes apply is unchanged in the future. The main driver of financial imbalance in the system, therefore, is the rate of cost increase. Cost are increasing because the ratio of beneficiaries to covered workers, who provide the bulk over the system’s revenues, is increasing. This in turn is largely due to demographic shifts, which are described above. The baby boom, followed by a sustained decline in births rate, has created an older society with more retirees collecting benefits relative to workers contributing taxes.