The Social Security Advisory Board spent more than two years exploring Social Security’s Representative Payee Program. The board is pleased to publish the Representative Payee Chart Collection, which first highlights data related to the administration of the program and then emphasizes the growing need for representative payees in the future. The collection complements the board’s January 2018 report, Improving Social Security’s Representative Payee Program.
Payee Chart Collection
A representative payee (rep payee) is appointed if the Social Security Administration (SSA) determines that an Old Age, Survivors, and Disability Insurance (OASDI) beneficiary or Supplemental Security Income (SSI) recipient is unable to manage their own finances. SSA field office employees are tasked with determining whether a beneficiary/recipient needs a rep payee, selecting the appropriate payee, monitoring some rep payees and when necessary, changing rep payees. At the end of 2016, nearly $5.8 billion in federal benefits/payments were managed per month by rep payees on behalf of 7.8 million beneficiaries/recipients.
In the charts below, hover the mouse over the content to view individual data points. Many of the charts are dynamic by program and age group. The charts may take several seconds to load.
Note that where data are shown by program, OASDI beneficiaries, SSI recipients and concurrent beneficiaries – those who receive both SSI payments and OASDI benefits – are displayed separately. When data are shown for a single program, then the figures include concurrent beneficiaries.
Index
- Chart 1: Number of Beneficiaries and Recipients with a Rep Payee, by Program and Age Group – December 2016
- Chart 2: Percent of Beneficiaries and Recipients with a Rep Payee, by Program and Age Group – December 2016
- Chart 3: Number of OASDI Beneficiaries, Age 18 and Over, by Eligibility Category and Rep Payee Status – December 2016
- Chart 4: Number of SSI Recipients, All Ages, by Eligibility Category and Rep Payee Status – December 2016
- Chart 5: Percent of Beneficiaries and Recipients with a Rep Payee, by Age Group and Program – December 2016
- Chart 6: Age Distribution for Beneficiaries and Recipients with a Rep Payee, by Program –December 2016
- Chart 7: Percent of OASDI Retired Workers with a Rep Payee, by Age Group –December 2016
- Chart 8: Relationship Distribution for Beneficiaries and Recipients with Rep Payee, by Program and Age Group – December 2016
- Chart 9: Number of Beneficiaries and Recipients with a Rep Payee, by Program and Age Group – December 1984 to 2016
- Chart 10: Observed and Projected Number of Beneficiaries and Recipients, Age 18 and Over, in Need of a Rep Payee, by Program – December 2013, 2025, and 2035
- Chart 11: Observed and Projected Number of OASDI Retired Workers, Age 85 or Older – December 1970 to 2040
- Chart 12: Percent of Health and Retirement Study (HRS) Sample with Cognitive Impairment Status, by Age Group – Waves 1 to 10
Program Administration (Charts 1 to 8)
Program Comparison (Charts 1 to 2)

Chart 1 shows the size of the rep payee program. The largest number of beneficiaries/recipients with a rep payee comes from the OASDI program (4.7 million). For OASDI-only beneficiaries with a rep payee, 62.2 percent are under age 18. There are a fewer number of SSI-only recipients with a rep payee (2.4 million). A smaller 46.1 percent of SSI recipients with a rep payee are under age 18. There are over 620,000 concurrent beneficiaries with a rep payee.
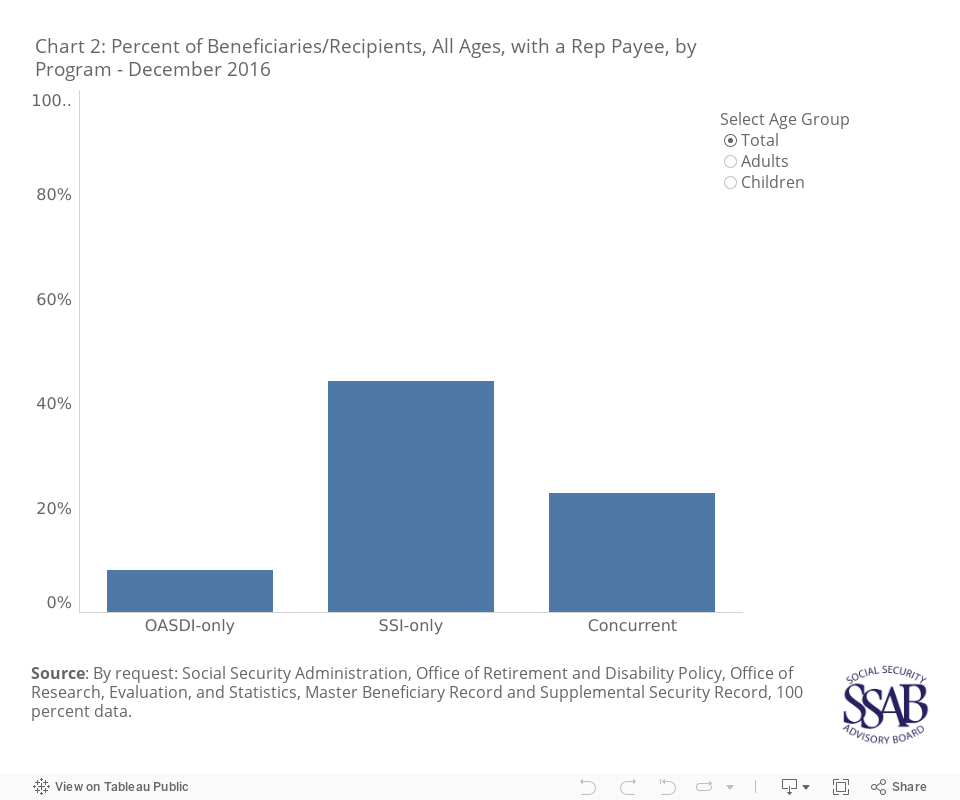
Chart 2 shows the share of beneficiaries/recipients who have a rep payee within each program. While there are a larger number of OASDI beneficiaries with a rep payee than SSI recipients, the share of SSI-only recipients with a rep payee (44.3 percent) is much higher than that of OASDI-only beneficiaries (8.1 percent). The difference lies in the appointment of rep payees for adults (30.0 percent for SSI compared to 3.2 percent for OASDI), as children are nearly always assigned a rep payee across programs. For concurrent beneficiaries, 22.8 percent have a rep payee.
Program Eligibility (Charts 3 to 4)

Chart 3 shows the size and share of rep payee appointment for each eligibility category for adult OASDI beneficiaries. The largest group of adult OASDI beneficiaries with a rep payee is workers with disabilities (over 900,000), but adult children with disabilities are most likely to have a rep payee (73.4 percent). Only 1.3 percent of retired workers have a rep payee.

Chart 4 shows the size and share of rep payee appointment among SSI recipients – of all ages. The largest group of SSI recipients with a rep payee is individuals with disabilities (3.0 million), who are also the most likely to have a rep payee (42.6 percent). It should be cautioned, however, that these numbers reflect both adult and child recipients; while available for OASDI, SSA does not provide data on rep payee status eligibility group by age. Further, it should be cautioned that the eligibility designation for SSI reflects the recipient’s initial determination, as SSA does not recategorize an individual with a disability as aged, for example.
Aging (Charts 5 to 7)

Chart 5 shows the proportion of beneficiaries/recipients with a rep payee for each age group. Generally, as age increases, the share of beneficiaries/recipients with a rep payee decreases.
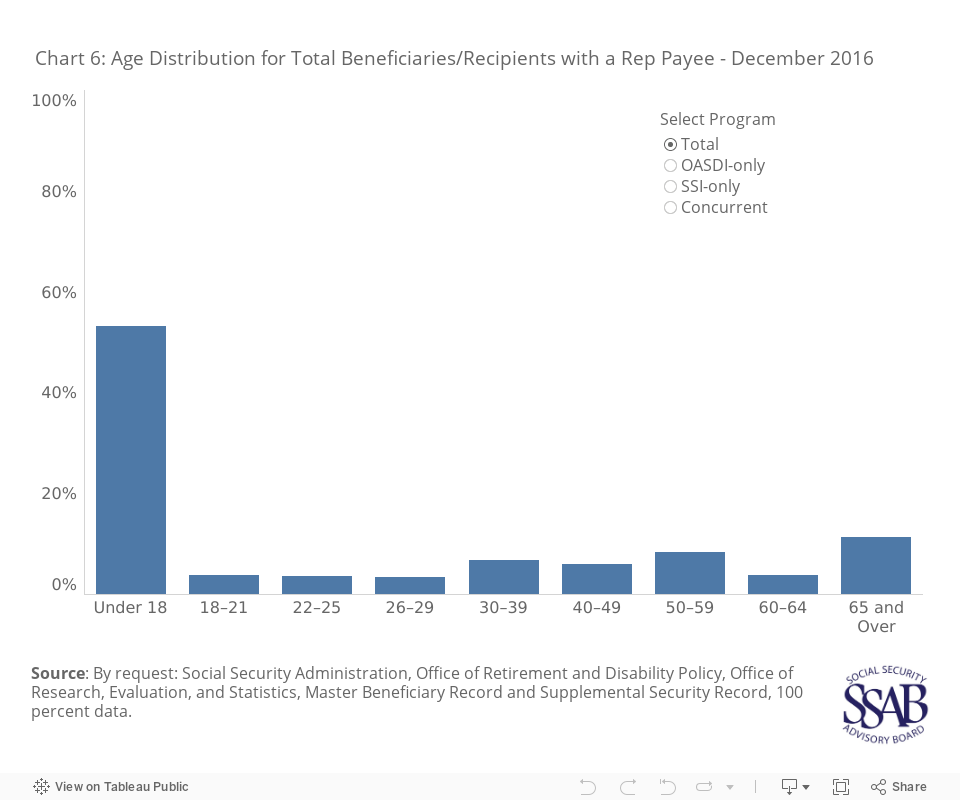
Chart 6 maps the age distribution for beneficiaries/recipients with a rep payee. Within the population of beneficiaries/recipients with a rep payee, most are children (53.2 percent) or elderly (11.3 percent). For OASDI the difference is starker with 62.2 percent under age 18 and 14.3 percent age 65 or older. SSI recipients are relatively more likely to be working age; 49.1 percent of SSI recipients are between the ages of 18 and 64.

As mentioned in Chart 3, 1.3 percent of OASDI retired worker beneficiaries have a rep payee.
Chart 7 describes how the rate of rep payee appointment increases as retired workers age. Only 0.3 percent of retired workers have a rep payee under age 65. By ages 75 to 84, the rate is 1.4 percent and by age 85 or older, the rate is 3.4 percent.
Rep Payee Relationships (Chart 8)
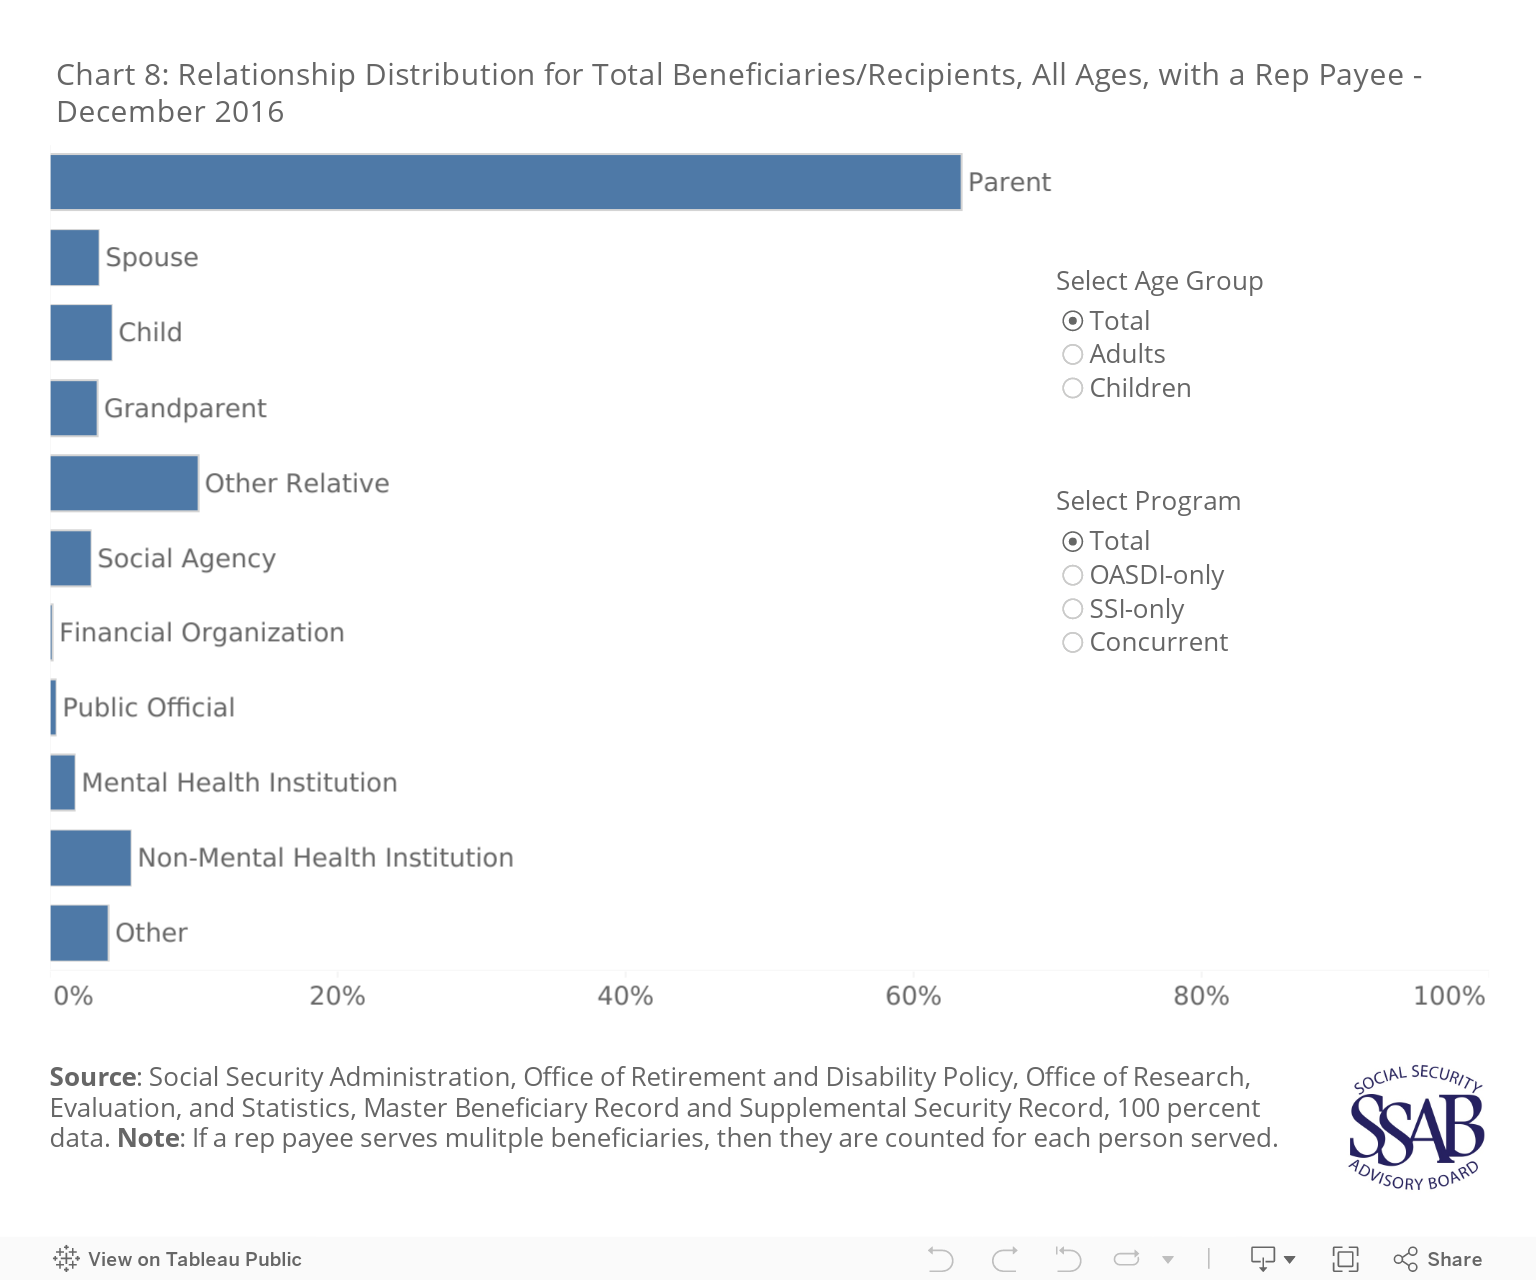
Chart 8 illustrates who serves as rep payees. SSA provides preference lists to field office staff to select the most appropriate rep payee for a beneficiary/recipient. Preference lists consider the rep payee’s relationship to the beneficiary/recipient, their custody status, and for organizations – whether they are nonprofit or for-profit. Unfortunately, the data shown below in Chart 8 cannot be directly compared to SSA’s preference lists, because SSA does not collect and publish data for whether individuals have custody or for whether an organization charges a fee or has a custodial relationship. Regardless, parents are most likely to serve as rep payee for each age group and program at varying degrees, from 90.6 percent for OASDI child beneficiaries to 23.1 percent for OASDI adult beneficiaries. Use the selector in the chart below to toggle between total beneficiaries/recipients, OASDI beneficiaries, SSI recipients, and concurrent beneficiaries as well as between total, adult and child beneficiaries/recipients.
The Demand for Rep Payees (Charts 9-12)
Looking Back (Chart 9)

Chart 9 shows how the rep payee program has grown over the last thirty years. The program has grown from 4.7 million beneficiaries/recipients with a rep payee in 1984 to 8.5 million in 2016. The growth has not been uniform across program and age group. For example, 2.7 million OASDI child beneficiaries made up 57.5 percent of the population with rep payees in 1984; by 2016, the number grew to 3.0 million, but the share fell to 35.6 percent. The relative share for the SSI program has grown, however. In 1984, 233,000 OASDI child beneficiaries made up 4.9 percent of the population with rep payees; by 2016, the number grew to 1.2 million and the share to 14.4 percent. It must be cautioned that OASDI and SSI totals double count concurrent beneficiaries. Please see note for more information.
Looking Forward (Charts 10 to 12)

Chart 10 displays estimates from Anguelov, Ravida, and Weathers (2015), which project that the number of adult beneficiaries/recipients in need of a rep payee will continue to grow from 2.9 million in 2013 to 3.6 million in 2035. This growth will be driven primarily by the population of OASDI beneficiaries. In 2013, 1.6 million adult OASDI beneficiaries had a rep payee; by 2035, the authors projects that the number will grow to 2.2 million.
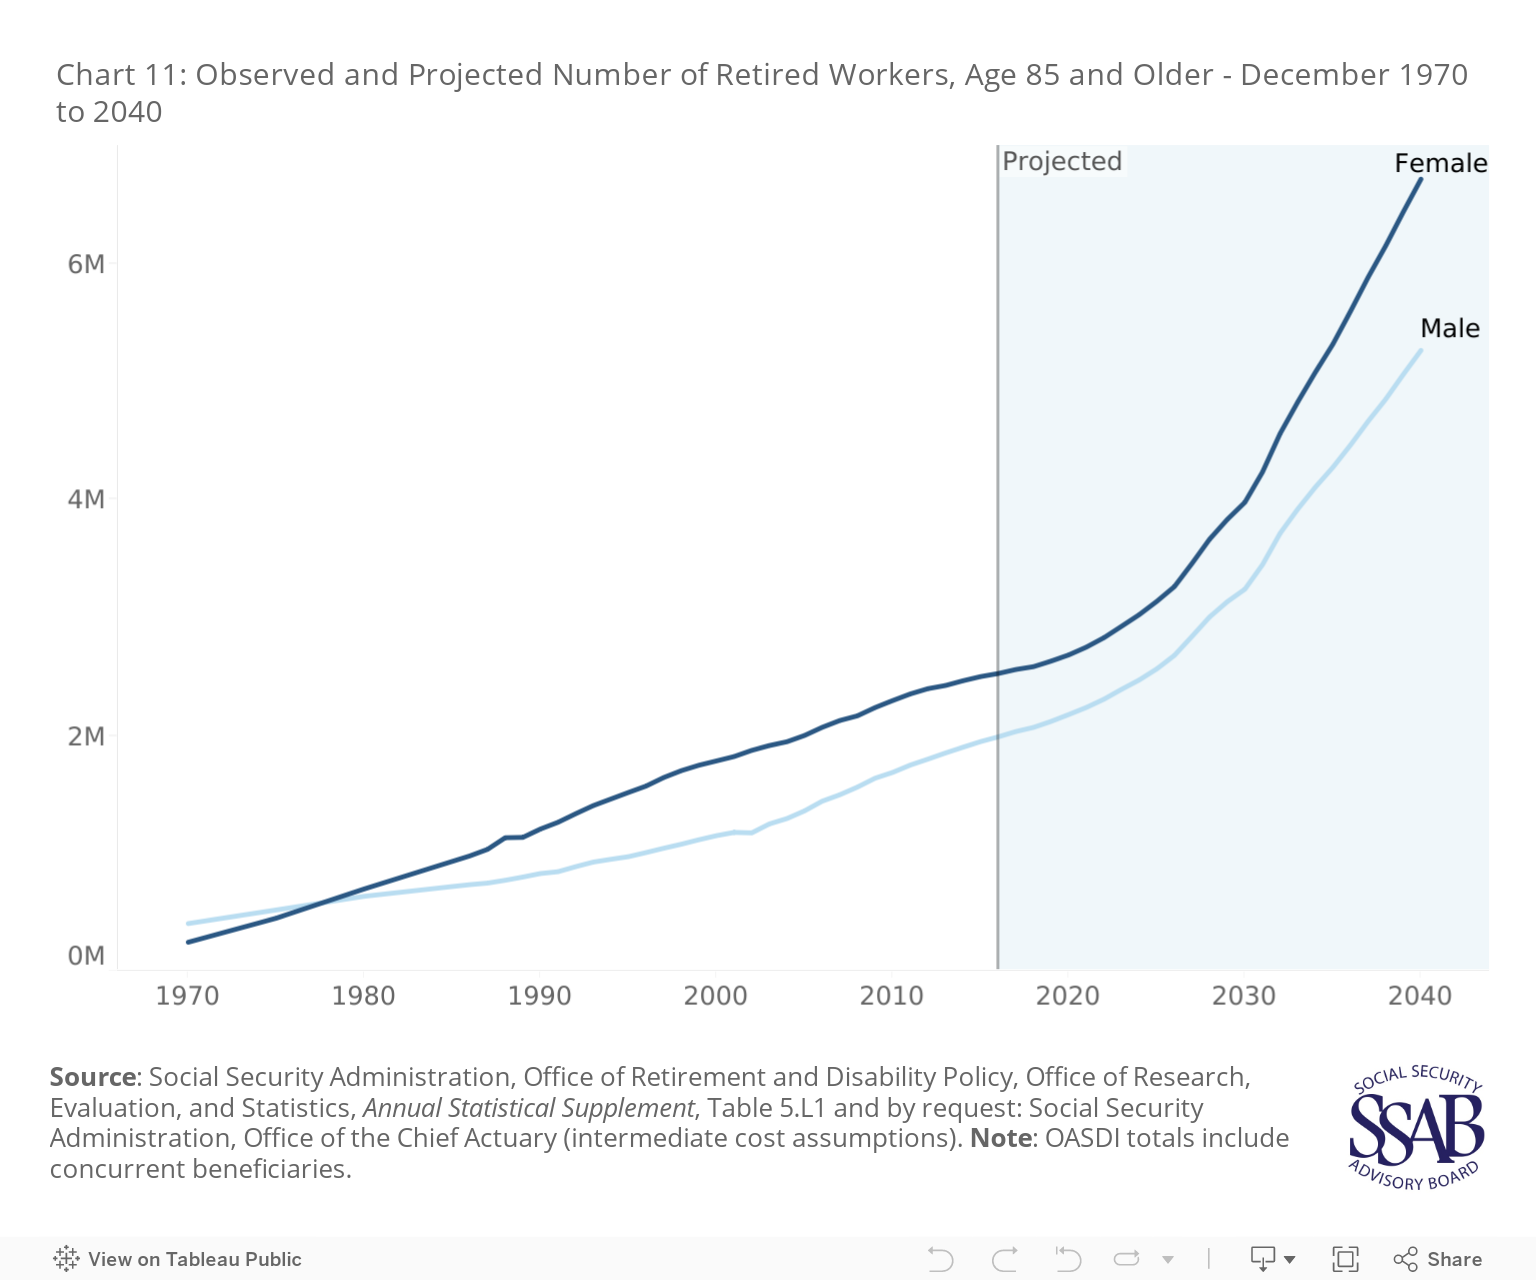
Chart 11 focuses on the largest eligibility group within OASDI – retired worker beneficiaries. As referenced in Chart 2 and Chart 7, 1.3 percent of retired workers have a rep payee, but among those retired workers age 85 and older, the rate is 3.4 percent. Chart 11 plots the projected number of retired workers age 85 or older. In 2016, there were 4.5 million retired workers age 85 and older; SSA projects this number to pass 7 million by 2030 and in 2040 reach nearly 12 million beneficiaries.
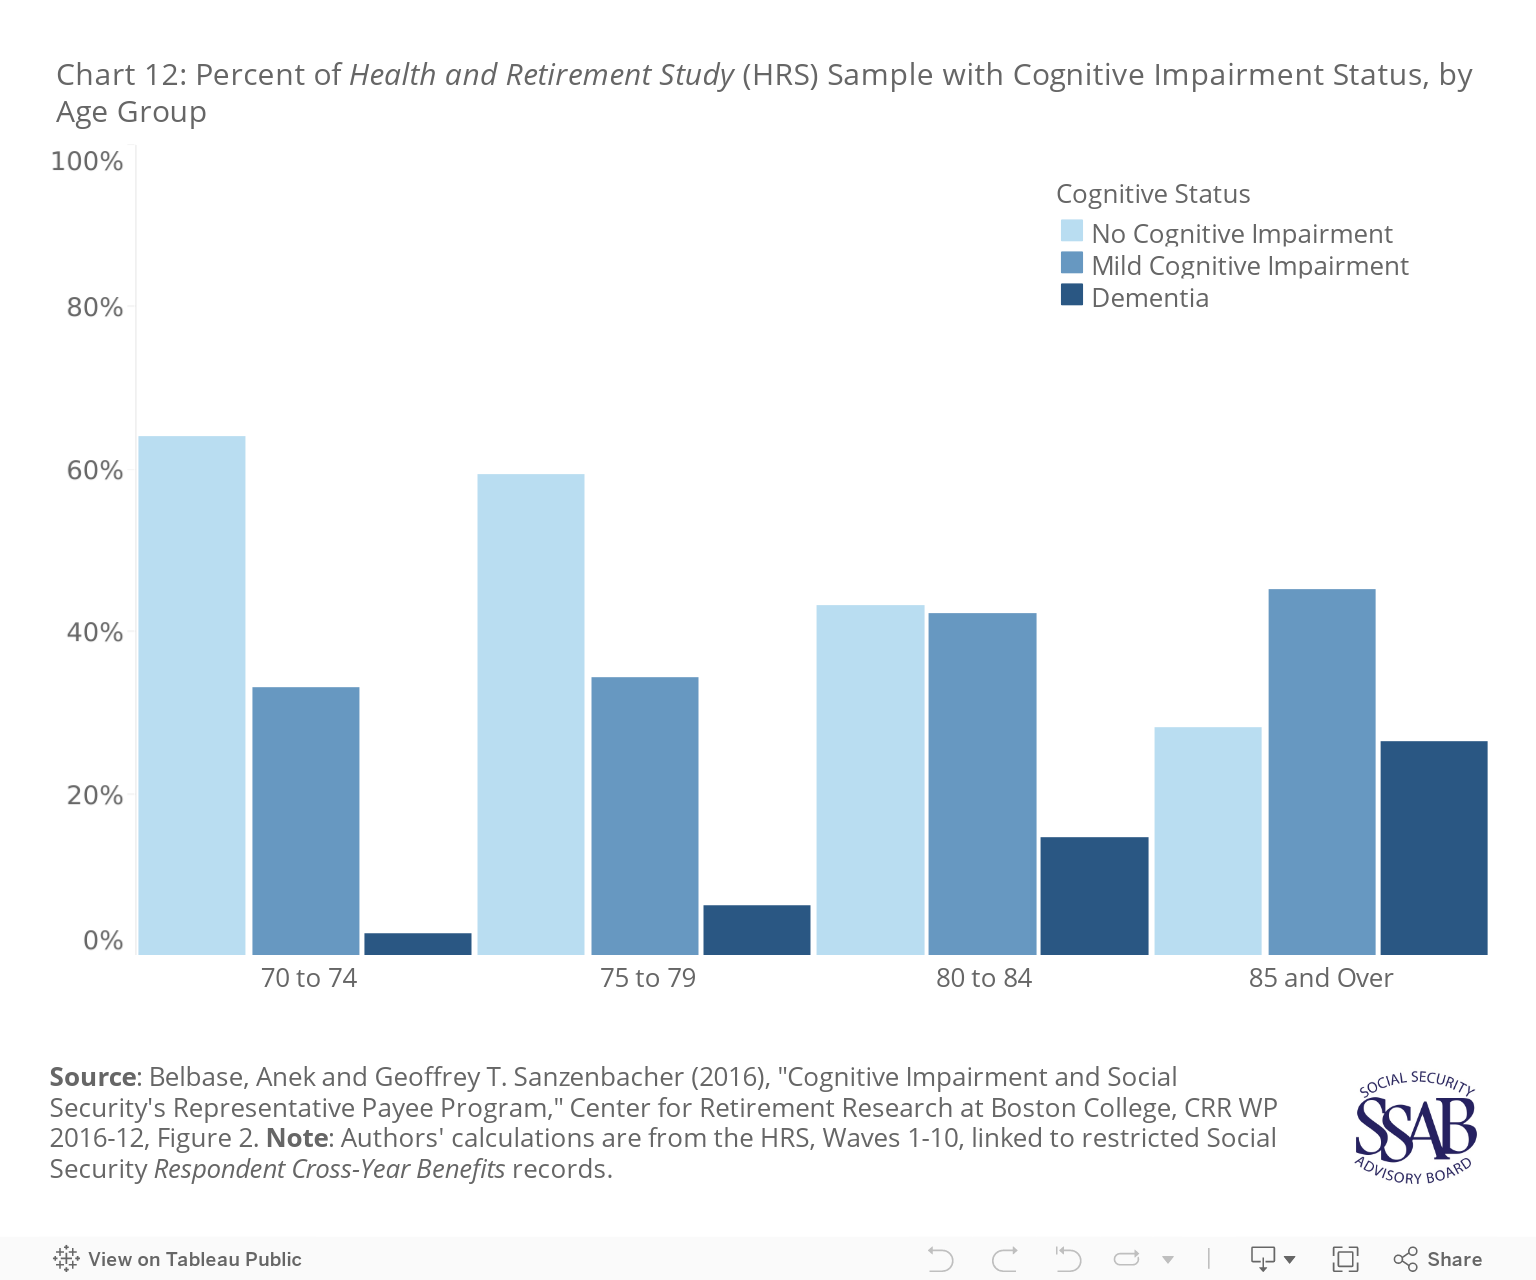
Chart 12 illustrates how the need for rep payees is affected as beneficiaries/recipients grow older. As displayed in Chart 2, Chart 7 and Chart 10, the rate of rep payee appointment grows as retired workers age. A principle mechanism in this shift is the interaction of age and cognitive impairment. Chart 12 relies on linked SSA administrative data which show how the rates of mild cognitive impairment and dementia grow. While 64.1 percent of individuals aged 70 to 74 had no cognitive impairment, for individuals aged 85 and over only 28.3 percent had no cognitive impairment. Concurrently, the rates of mild cognitive impairment and dementia increase from 33.2 and 2.7 percent for individuals aged 70 to 74 to 45.2 and 26.5 percent for individuals aged 85 and over, respectively.